The Relative Momentum Index function determines the internal momentum of a field using the number of upward and downward price changes across a given number of bars over a given period of time. The Relative Momentum Index is based on a ratio of the average upward changes to the average downward changes over a given period of time. The individual changes are calculated for … [Read more...]
Application Of Relative Momentum Index
The Relative Momentum Index function determines the internal momentum of a field using the number of upward and downward price changes across a given number of bars over a given period of time. Formula to calculate RMI The Relative Momentum Index is based on a ratio of the average upward changes to the average downward changes over a given period of time. The individual … [Read more...]
Relative Momentum Index Explained ( RMI Indicator )
The Relative Momentum Index function determines the internal momentum of a field using the number of upward and downward price changes across a given number of bars over a given period of time. The Relative Momentum Index is based on a ratio of the average upward changes to the average downward changes over a given period of time. The individual changes are calculated for … [Read more...]
Parabolic SAR : technical indicator
The parabolic SAR is a technical indicator that is used by many traders to determine the direction of an asset's momentum and the point in time when this momentum has a higher-than-normal probability of switching directions. Sometimes known as the "stop and reversal system", the parabolic SAR was developed by the famous technician Welles Wilder, creator of the relative strength … [Read more...]
TRIX: Momentum indicator
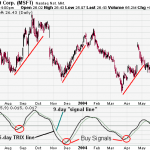
Introduction TRIX is a momentum indicator that displays the percent rate-of-change of a triple exponentially smoothed moving average of a security's closing price. It was developed in the early 1980's by Jack Hutson, an editor for Technical Analysis of Stocks and Commodities magazine. Oscillating around a zero line, TRIX is designed to filter out stock movements that are … [Read more...]