INTRADAY During a single trading day.Another way of saying "within the day". Intraday price movements are particularly important to short-term traders looking to make many trades over the course of a single trading session. The term intraday is occasionally used to describe securities that trade on the markets during regular business hours, such as stocks and ETFs, as opposed … [Read more...]
Elliott Wave Theory – the concept
Elliott Wave Theory was developed by Ralph Nelson Elliott by discovering that stock markets, thought to behave in a somewhat chaotic manner, in fact traded in repetitive cycles. Elliott discovered that these market cycles resulted from investors' reactions to outside influences, or predominant psychology of the masses at the time. He found that the upward and downward … [Read more...]
Golden rules of trading
We are jotting down some golden rules for you , that can help you with profit maximization . 1. Capital should be divided in 10 risk parts. 2. Over trading isa big NO 3. Never place any order for BUY/SELL without knowing the stop-loss conditions 4. Never let profit turn into loss. 5. Trading as per the trend is advised 6. Never take the lead in which you may loose … [Read more...]
Gap analysis
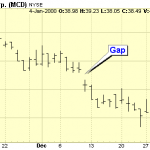
Gaps and Gap Analysis a gap is an area on a price chart indicates that there were no trades. Normally this occurs between the time period when the market closes on one day and open's up the next day. Lot's of things can cause this, such as an earnings report coming out after the stock market has closed for the day. If the earnings were significantly higher than expected, many … [Read more...]
Double top :concept
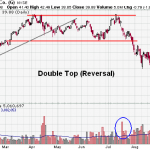
A term used in technical analysis to describe the rise of a stock, a drop, another rise to the same level as the original rise, and finally another drop.The double top is a major reversal pattern that forms after an extended uptrend. As its name implies, the pattern is made up of two consecutive peaks that are roughly equal, with a moderate trough in-between. The double top … [Read more...]