The Relative Strength Index (RSI), developed by J. Wellis Wilder is very useful and is a popular momentum oscillator. The RSI is used to compare the magnitude of a stock's recent gains to the magnitude of its recent losses. It then turns that information into a number that ranges from 0 to 100. It takes a single parameter, the number of time periods to use in the calculation. … [Read more...]
Relative Strength Index : The Concept
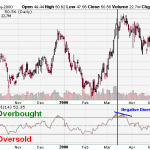
The RSI is a momentum indicator that helps in comparing the magnitude of recent gains to recent losses in an attempt to determine overbought and oversold conditions of an asset. It is calculated using the following formula: RS = Average of x days' up closes / Average of x days' down closes The RSI usually ranges from 0 to 100. Once the RSI approaches the 70 level, an … [Read more...]
How to Calculate Relative Strength Index?
Calculation of RSI A technical momentum indicator that compares the magnitude of recent gains to recent losses in an attempt to determine overbought and oversold conditions of an asset. It is calculated using the following formula: RSI = 100 - 100 ______ 1 + RS RS = Average of x days' up closes / Average of x days' down closes As you can … [Read more...]
Relative Strength Index: The Basic Concept
The Relative Strength Index (RSI) is a trading indicator in the technical analysis of financial markets. It is intended to indicate the current and historical strength or weakness of a market based on the closing prices of completed trading periods. It assumes that prices close higher in strong market periods, and lower in weaker periods and computes this as a ratio of the … [Read more...]
Cutler’s RSI : Relative Strength Index
Cutler's RSI which is another kind of Welles Wilder's original Relative Strength Index turns out to be a momentum oscillator used to find and demonstrate overbought and oversold conditions. It does so by keying on special levels - usually 30 and 70 - on a "0 to 100-chart". The Relative Strength Index (RSI) is a financial technical analysis momentum oscillator measuring the … [Read more...]