NiftyLiveCharts Blog

we helps you to understand the Stock Market

Gap analysis

27/10/2009 by admin

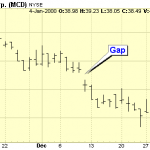
Gaps and Gap Analysis a gap is an area on a price chart indicates that there were no trades. Normally this occurs between the time period when the  market closes on one day and open's up the next day. Lot's of things can cause this, such as an earnings report coming out after the stock market has closed for the day. If the earnings were significantly higher than expected, many … [Read more...]

Breakouts from Bullish patterns

26/10/2009 by admin

There's always a bull market in some or the other place . We've found several in energy, agriculture, and retail. Origin Agritech (SEED) - Bullish Triangle SEED is tracing one big bullish triangle. SEED is a small cap that's been extremely volatile. The ups and downs in the stock have resulted in the formation of a triangle over the last five months. Look for a break … [Read more...]

Follow us on FaceBook

Post Tags

assets Bank Nifty BankNifty Bank Nifty Breakdown Bank Nifty Breakout Breakdown Levels Breakout levels day trading Derivatives dividends DLF Ltd. is a sell finance financial planning forex forex indicators forex trading Future and Options futures and options future trading investing investment jaiprakash associates ltd . is a buy Levels loans money mutual funds nifty Nifty Breakdown Nifty Breakout options option trading put option Ranbaxy Laboratories Ltd is a buy Resistance shares stock STOCK MARKET STOCKS stock trading Support Tata Motors Ltd. is a buy TAX technical analysis trading trading in stocks

Categories

  • Daily Nifty Levels
  • Daily Stock Tips
  • Derivatives
  • Future and Options
  • General
  • Results
  • Share Market Basics
  • Short Headlines
  • Swap
  • Trade Like a Professional
  • Trading Basics
  • Trading price patterns
  • Weekly Support and resistance levels

Copyright © 2025 · Magazine Pro Theme on Genesis Framework · WordPress · Log in