Average Directional Movement Index Technical Indicator (ADX) helps to determine if there is a price trend. It was developed and described in detail by Welles Wilder in his book "New concepts in technical trading systems". However, the main purpose of the ADX is to determine whether a stock, future, or currency pair is trending or is in a trading range. Determining which mode a … [Read more...]
Average Directional Movement Index Rating (ADXR) Explained
The Average Directional Movement Index Rating (ADXR) indicator is an attempt to quantify the momentum change of the ADX indicator. It was developed by J. Welles Wilder and described in his book "New Concepts In Technical Trading Systems", written in 1978. The ADXR is constructed adding the current ADX value and an ADX value n-Periods ago and then dividing that sum by two. This … [Read more...]
TRIX: Momentum indicator
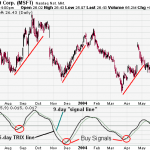
Introduction TRIX is a momentum indicator that displays the percent rate-of-change of a triple exponentially smoothed moving average of a security's closing price. It was developed in the early 1980's by Jack Hutson, an editor for Technical Analysis of Stocks and Commodities magazine. Oscillating around a zero line, TRIX is designed to filter out stock movements that are … [Read more...]
Forex Technical Indicators
Momentum Oscillators Momentum oscillators react very quickly to short-term changes in price, flipping back and forth between overbought and oversold levels. Oscillators are useful in both ranging and trending currency markets. The most common momentum oscillators include Relative Strength Index (RSI), Commodity Channel Index (CCI) and the Stochastic Oscillator. Let's take … [Read more...]
Weighted moving average
A weighted average is any average that has multiplying factors to give different weights to different data points. Mathematically, the moving average is the convolution of the data points with a moving average function; in technical analysis, a weighted moving average (WMA) has the specific meaning of weights which decrease arithmetically A weighted moving average is also … [Read more...]