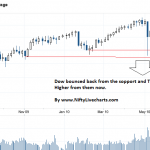
Date 08-July-2010 Time 08:30 AM Can Nifty touch 5500 – 5550 now ? Dow Jones has made another remarkable jump from its 9800 mark. This level was quite crucial, as the next trend has to be decided by trading of US markets. Last time when Dow Jeans came to 9800 Level, the Nifty was trading at 4800 Levels too and as Dow Jeans has shown the strength, the Nifty also traded higher … [Read more...]
McClellan Oscillator (McClellan Osc) Explained

McClellan oscillator is developed by Sherman and Marian McClellan.It represents the total difference of the advancing and declining issues on the New York Stock Exchange.McClellan oscillator is a breadth indicator and is based on the advancing and declining issues.It finds out the extent of the involvement in the stock market fluctuations through declines and advances. A big … [Read more...]
Volume Rate of Change (VROC)

Volume Rate of Change (VROC), is an important indicator of gauging an instrument's volume changes. It mathematically resembles Price ROC but indicates the ROC of the security's volume and not its closing price. The Volume ROC demonstrates the speed at which volume is shifting. This can turn out to be rather helpful as almost each essential chart formation, such as peaks, … [Read more...]
Positive Volume Index: Basic Concept

The Positive Volume Index was introduced by Norman Fosback and is often used in conjunction with Negative Volume Index to identify bull and bear markets.The positive volume index (PVI) is an indicator which tracks volume as it increases from the previous day Postive Volume Index Formula If the current volume is greater than the previous day, then the formula for the PVI … [Read more...]
Diagonal Spread
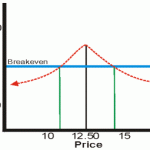
A Diagonal spread is an options strategy established by simultaneously entering into a long and short position in two options of the same type i.e, two call options or two put options. It is also a strategy with different strike prices and expiration dates. The diagonal spread is similar to the calendar spread, where near term options are sold while long term options are … [Read more...]