A weighted average is any average that has multiplying factors to give different weights to different data points. Mathematically, the moving average is the convolution of the data points with a moving average function; in technical analysis, a weighted moving average (WMA) has the specific meaning of weights which decrease arithmetically A weighted moving average is also … [Read more...]
Variable moving average
Variable moving average A VMA is an EMA that's able to regulate its smoothing percentage based on market inconstancy automatically. Its sensitivity grows by providing more weight to the ongoing data as it generates a better signal indicator for short and long term markets. The majority of ways for measuring Moving Averages cannot compensate for sideways moving prices versus … [Read more...]
Time series moving average
Time series moving average The time series moving average is calculated using linear regression techniques. Rather than plotting a straight linear regression line, a time series moving average plots the last point of the line. It does this using the specified number of periods for each day. The individual points are then connected together with a line to form a time series … [Read more...]
Exponential moving average
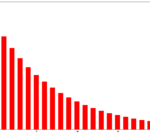
An exponential moving average (EMA), sometimes also called an exponentially weighted moving average (EWMA), applies weighting factors which decrease exponentially. The weighting for each older data point decreases exponentially, giving much more importance to recent observations while still not discarding older observations entirely. The graph at right shows an example of the … [Read more...]
Simple moving average
A simple, or arithmetic, moving average that is calculated by adding the closing price of the security for a number of time periods and then dividing this total by the number of time periods. Short-term averages respond quickly to changes in the price of the underlying, while long-term averages are slow to react. For example, to calculate a 21-day moving average of Geo2 … [Read more...]