Further calculation of the True range is necessary to calculate the Directional Indicators (+DI and -DI). The true range is always positive. It is defined as the current highest value of the difference among today’s highest price minus today’s lowest price; today’s highest price minus yesterday’s closing price; and today’s lowest price minus yesterday’s closing price. Wilder, … [Read more...]
Directional Movement Index : The Concept
The Directional Movement Index is also known as DMI. DMI is a momentum indicator . It is calculated using the price. It first compares the current price with the previous price range, and displays the result as an upward movement line (+DI), and a downward movement line (-DI), between 0 and 100. The DMI also helps in calculating the strength of the upward or downward movement, … [Read more...]
Commodity Selection Index (CSI): The Concept
The CSI was developed by Welles Wilder and was first published in the book New Concepts in Technical Trading Systems. The higher the CSI, the greater the volatility and strength of trend. Traders use the CSI is to find commodities with the highest volatility, because it has the greatest odds of quick gains. The CSI is designed for short-term traders that have money … [Read more...]
DMI, Directional Momentum Index
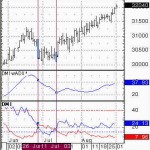
Directional Momentum Index ,DMI.is an indicator used in technical analysis to determine if a financial instrument, such as a stock, is trending in particular direction. It is broken into the positive directional indicator (+DI), negative directional indicator (-DI) and Average Directional Index (ADX). The value of the index can be zero. The higher the value of the DMI, the … [Read more...]
Average Directional Movement Index Rating (ADXR) Explained
The Average Directional Movement Index Rating (ADXR) indicator is an attempt to quantify the momentum change of the ADX indicator. It was developed by J. Welles Wilder and described in his book "New Concepts In Technical Trading Systems", written in 1978. The ADXR is constructed adding the current ADX value and an ADX value n-Periods ago and then dividing that sum by two. This … [Read more...]