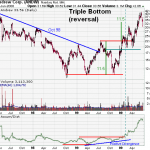
The triple bottom is a reversal pattern made up of three equal lows followed by a breakout above resistance. While this pattern can form over just a few months, it is usually a long-term pattern that covers many months.it is a pattern used in technical analysis to predict the reversal of a prolonged downtrend. The pattern is identified when the price of an asset creates three … [Read more...]
Triple Top (Reversal):concept
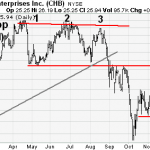
The triple top is a reversal pattern made up of three equal highs followed by a break below support. A pattern used in technical analysis to predict the reversal of a prolonged uptrend. This pattern is identified when the price of an asset creates three peaks at nearly the same price level. The bounce off the resistance near the third peak is a clear indication that buying … [Read more...]
Trend Lines

Technical analysis is built on the assumption that prices trend. Trend Lines are an important tool in technical analysis for both trend identification and confirmation. A trend line is a straight line that connects two or more price points and then extends into the future to act as a line of support or resistance. Many of the principles applicable to support and resistance … [Read more...]
Renko Charts – the concept ( Explained )
Renko charts are price charts with rising and falling diagonal lines of boxes that are either filled or hollow. Renko charts are "time independent" charts that do not have constantly spaced time axes. A type of chart, developed by the Japanese, that is only concerned with price movement; time and volume are not included. It is thought to be named for the Japanese word for … [Read more...]
Kagi Charts
Kagi charts are price charts with thick and thin vertical lines connected by short horizontal lines. it is a type of chart developed by the Japanese in the 1870s that uses a series of vertical lines to illustrate general levels of supply and demand for certain assets. Thick lines are drawn when the price of the underlying asset breaks above the previous high price and is … [Read more...]