NiftyLiveCharts Blog

we helps you to understand the Stock Market

Chande Momentum Oscillator : Application and Chart

02/02/2010 by admin

Chande Momentum Oscillator and Trading Trading with the chande momentum oscillator is a challenging task. Since the indicator will oscillate between +100 and -100, a break of +50 could mean that it is overbought, but remember the indicator has another 50 points it can run. Many traders apply a moving average to the indicator and will use crosses of the CMO and a simple … [Read more...]

Chande Momentum Oscillator : The Concept

02/02/2010 by admin

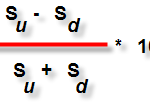
Chande momentum oscillator is a technical momentum indicator. It is created by calculating the difference between the sum of all recent gains and the sum of all recent losses and then dividing the result by the sum of all price movement over the period. This oscillator is also similar to other momentum indicators such as the Relative Strength Index and the Stochastic Oscillator … [Read more...]

Follow us on FaceBook

Post Tags

assets Bank Nifty BankNifty Bank Nifty Breakdown Bank Nifty Breakout Breakdown Levels Breakout levels day trading Derivatives dividends DLF Ltd. is a sell finance financial planning forex forex indicators forex trading Future and Options futures and options future trading investing investment jaiprakash associates ltd . is a buy Levels loans money mutual funds nifty Nifty Breakdown Nifty Breakout options option trading put option Ranbaxy Laboratories Ltd is a buy Resistance shares stock STOCK MARKET STOCKS stock trading Support Tata Motors Ltd. is a buy TAX technical analysis trading trading in stocks

Categories

  • Daily Nifty Levels
  • Daily Stock Tips
  • Derivatives
  • Future and Options
  • General
  • Results
  • Share Market Basics
  • Short Headlines
  • Swap
  • Trade Like a Professional
  • Trading Basics
  • Trading price patterns
  • Weekly Support and resistance levels

Copyright © 2025 · Magazine Pro Theme on Genesis Framework · WordPress · Log in