NiftyLiveCharts Blog

we helps you to understand the Stock Market

ADX Indicator : Application & Chart

16/02/2010 by admin

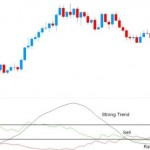
Average Directional Index is an indicator which fluctuates between 0 and 100. Readings below 20 indicate a weak trend and readings above 40 indicate a strong trend. ADX does indicates just the strength of the trend, up or down. With ADX there are two lines which are often plotted, that indicate direction. The lines are +DI (positive directional indicator) and -DI (negative … [Read more...]

ADX Indicator : The Concept

16/02/2010 by admin

The ADX indicator is a tool used to measure the strength of a trend and can be very useful to determine if a trend is strong or weak. High readings indicate a strong trend and low readings indicate a weak trend. A trading range is likely to develop when the trading range is showing a low reading. So one should always avoid stocks with low readings. ADX stands for Average … [Read more...]

Follow us on FaceBook

Post Tags

assets Bank Nifty BankNifty Bank Nifty Breakdown Bank Nifty Breakout Breakdown Levels Breakout levels day trading Derivatives dividends DLF Ltd. is a sell finance financial planning forex forex indicators forex trading Future and Options futures and options future trading investing investment jaiprakash associates ltd . is a buy Levels loans money mutual funds nifty Nifty Breakdown Nifty Breakout options option trading put option Ranbaxy Laboratories Ltd is a buy Resistance shares stock STOCK MARKET STOCKS stock trading Support Tata Motors Ltd. is a buy TAX technical analysis trading trading in stocks

Categories

  • Daily Nifty Levels
  • Daily Stock Tips
  • Derivatives
  • Future and Options
  • General
  • Results
  • Share Market Basics
  • Short Headlines
  • Swap
  • Trade Like a Professional
  • Trading Basics
  • Trading price patterns
  • Weekly Support and resistance levels

Copyright © 2025 · Magazine Pro Theme on Genesis Framework · WordPress · Log in