
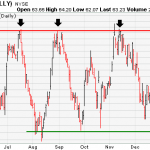
Technical analysis is built on the assumption that prices trend. Trend Lines are an important tool in technical analysis for both trend identification and confirmation. A trend line is a straight line that connects two or more price points and then extends into the future to act as a line of support or resistance. Many of the principles applicable to support and resistance … [Read more...]
Support and Resistance
Support and resistance represents key junctions where the forces of demand and supply meet. In the financial markets, prices are driven by excessive supply (down) and demand (up).As demand increases, prices advance and as supply increases, prices decline. When supply and demand are equal, prices move sideways as bulls and bears slug it out for control. What Is Support? The … [Read more...]
Renko Charts – the concept ( Explained )
Renko charts are price charts with rising and falling diagonal lines of boxes that are either filled or hollow. Renko charts are "time independent" charts that do not have constantly spaced time axes. A type of chart, developed by the Japanese, that is only concerned with price movement; time and volume are not included. It is thought to be named for the Japanese word for … [Read more...]
Kagi Charts
Kagi charts are price charts with thick and thin vertical lines connected by short horizontal lines. it is a type of chart developed by the Japanese in the 1870s that uses a series of vertical lines to illustrate general levels of supply and demand for certain assets. Thick lines are drawn when the price of the underlying asset breaks above the previous high price and is … [Read more...]
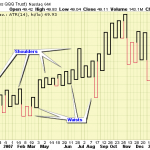
Introduction to Chart Patterns
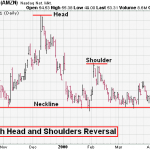
In a day there are thousands of market participants buying and selling securities with wide variety of reasons : hope of gain, fear of loss, tax consequences, short-covering, hedging, stop-loss triggers, price target triggers, fundamental analysis, technical analysis, broker recommendations and a few dozen more. it is a danuting process to figure out why participants are … [Read more...]