This is an "Average" correlation derived from the Basket IV formula. The "Basket IV" can be derived from the actual market prices of the Index option. In the term on the right, you get the correlation of every existing pair of stock component. If you replace these corr(i,j) terms by only one term CORR assuming they are the same, then you can extract this in front of the … [Read more...]
Commodity Selection Index: Application and Charts
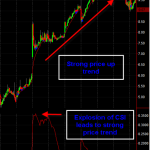
Commodit Selection Index as an indicator is an extension of DMI. This indicator can help traders to properly select instruments for investment. The selection is based on DMI indicator with considering of capital, leverage, and comission fee. A high CSI rating indicates that the commodity has strong trending and volatility characteristics. The trending characteristics are … [Read more...]
Commodity Selection Index (CSI): The Concept
The CSI was developed by Welles Wilder and was first published in the book New Concepts in Technical Trading Systems. The higher the CSI, the greater the volatility and strength of trend. Traders use the CSI is to find commodities with the highest volatility, because it has the greatest odds of quick gains. The CSI is designed for short-term traders that have money … [Read more...]
Free Stock Tips For 4th February 2010
The Various- Daily Stock Recommendation Given by the various analysts and Stock Brokers are: Indian Hotels Company Ltd. - Daily stock recommendation 04-02-2010 Source Action Tip Period Target Price (Rs.) Sudarshan Sukhani Buy - 0.00 Bharat Heavy Electricals Ltd. - Daily stock recommendation 04-02-2010 Source Action Tip Period Target … [Read more...]
Nifty Levels for 4th February 2010
Please find the correct levels for nifty The Nifty Levels for 4th February 2010 are First Resistance = 4966 First Support =4860 Second Resistance =5011 Second Support =4799 Breakout above = 5072 Break down Below =4754 The above levels are for intraday only For Sure Shot pack and good Gains in Nifty Please visit Nifty Live Charts.com … [Read more...]