Developed by Tushar Chande, the Intraday Momentum Index (IMI) is a cross-breed between the RSI and candlestick analysis. The calculation of the IMI is very similar to the RSI, except it uses the relationship between the intraday opening and closing prices to determine whether the day is “up” or “down.” If the close is above the open, it is an up day. If the close is below … [Read more...]
Intraday Momentum Index : The Concept
The Intraday Momentum Index was developed by Tushar Chande. A combination of the Relative Strength Index and Candlestick Analysis gives the Intraday Momentum Index. The IMI calculation is similar to RSI, but there lies a difference. The intraday opening and closing prices relationships are used here in order to find out if the day is up or down. An up day means that the … [Read more...]
Klinger Oscillator : Application and Chart
The KO was developed by Stephen J. Klinger with two opposite goals in mind: 1. To be sensitive enough to signal short-term tops and bottoms 2. To be accurate enough to reflect the long-term flow of money into and out of a security. The KO is based on the following trends: Price range whether high or low, is a measure of movement and volume is the force behind … [Read more...]
Klinger Oscillator : The Concept
The Klinger oscillator was developed by Stephen J. Klinger. The sense of the Klinger Histogram is to align the Klinger Volume Oscillator reference line to zero. It was developed in assistance to short- and long-term analysis. The Klinger oscillator estimates volume-based money flow directions. There are three types of information that Klinger Oscillator deals with : The … [Read more...]
Herrick Payoff Index : Application and Chart
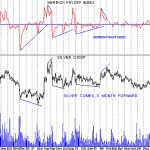
John Herrick developed the Herrick Payoff Index. It tracks volume, price and open interest into an aggregate value that is meant to capture trends and their reversals. HPI uses daily high and low prices, volume and open interest - preferably of all contracts from a period of at least three weeks. HPI applies these to prices of the most active delivery month. Instead of using … [Read more...]