Originally developed by Donald Lambert, The Commodity Channel Index (CCI) is an oscillator which has also been featured in his book "Commodities Channel Index: Tools for Trading Cyclical Trends". The indicator, since its introduction, has grown in popularity and is now a very common tool for traders to identify cyclical trends not only in commodities but also equities and … [Read more...]
Optimal Trader Adaptive Moving Average : Application & Chart
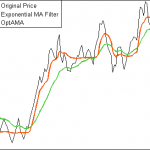
Technical analysis is a field in which there is always an ambition to smooth signals for instance stock price data to reduce their noise. This smoothing is performed with a moving average. A simple 10-day moving average of closing prices is the mean of the previous 10 days closing prices. Without smoothing indicators raise more erroneous signals because of noise in the stock … [Read more...]
Optimal Trader Adaptive Moving Average : The Concept
The Optimal Trader usually uses an in-house developed adaptive moving average filter for most indicators. Optimal Trader Adaptive Mean Average filter, reacts fast on major price changes and smoothes noise efficiently in stock data. The results have been signals in many models and fewer signals with some errors, when the trend is uncertain. Trading signals are raised on a … [Read more...]
Free Stock Tips for 16th Februrary 2010
The Various – Daily Stock Recommendation Given by the various analysts and Stock Brokers are : Pantaloon Retail (India) Ltd. - Daily stock recommendation 16-02-2010 Source Action Tip Period Target Price (Rs.) Sudarshan Sukhani Buy, stop loss Rs 415 - 435.00 Vijaya Bank - Daily stock recommendation 16-02-2010 Source Action Tip Period … [Read more...]
Nifty Levels for 16th February 2010
Please find the correct levels for nifty The Nifty Levels for 16th February 2010 are First Resistance = 4831 First Support =4768 Second Resistance =4867 Second Support =4741 Breakout above = 4894 Break down Below =4705 The above levels are for intraday only For Sure Shot pack and good Gains in Nifty Please visit Nifty Live Charts.com … [Read more...]