The Various – Daily Stock Recommendation Given by the various analysts and Stock Brokers are : Rashtriya Chemicals & Fertilizers Ltd. - Daily stock recommendation 22-02-2010 Source Action Tip Period Target Price (Rs.) Anil Singhvi Buy, stop loss Rs 103 - 110.00 Tata Motors Ltd. - Daily stock recommendation 22-02-2010 Source Action Tip … [Read more...]
Nifty Levels for 22nd February 2010
Please find the correct levels for nifty The Nifty Levels for 22nd February 2010 are First Resistance = 4890 First Support =4802 Second Resistance =4931 Second Support =4755 Breakout above = 4978 Break down Below =4714 The above levels are for intraday only For Sure Shot pack and good Gains in Nifty Please visit Nifty Live Charts.com … [Read more...]
Relative Strength Index : Application & Chart
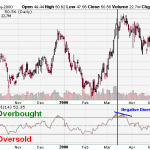
The Relative Strength Index (RSI), developed by J. Wellis Wilder is very useful and is a popular momentum oscillator. The RSI is used to compare the magnitude of a stock's recent gains to the magnitude of its recent losses. It then turns that information into a number that ranges from 0 to 100. It takes a single parameter, the number of time periods to use in the calculation. … [Read more...]
Relative Strength Index : The Concept
The RSI is a momentum indicator that helps in comparing the magnitude of recent gains to recent losses in an attempt to determine overbought and oversold conditions of an asset. It is calculated using the following formula: RS = Average of x days' up closes / Average of x days' down closes The RSI usually ranges from 0 to 100. Once the RSI approaches the 70 level, an … [Read more...]
Swing Index Indicator : Application & Chart
The Accumulation Swing Index helps showing the line of the real market. The Accumulative Swing Index uses a scale from 0 to 100 for an up trend and 0 to -100 for a down trend. The Swing Index was developed by Welles Wilder. The ASI has a positive value if a long-term trend is up, and if long-term trend is down indicator appears in a negative value. During sideways moving … [Read more...]