The CSI was developed by Welles Wilder and was first published in the book New Concepts in Technical Trading Systems. The higher the CSI, the greater the volatility and strength of trend. Traders use the CSI is to find commodities with the highest volatility, because it has the greatest odds of quick gains. The CSI is designed for short-term traders that have money … [Read more...]
Chande Momentum Oscillator : Application and Chart
Chande Momentum Oscillator and Trading Trading with the chande momentum oscillator is a challenging task. Since the indicator will oscillate between +100 and -100, a break of +50 could mean that it is overbought, but remember the indicator has another 50 points it can run. Many traders apply a moving average to the indicator and will use crosses of the CMO and a simple … [Read more...]
Chande Momentum Oscillator : The Concept
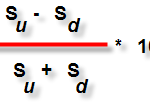
Chande momentum oscillator is a technical momentum indicator. It is created by calculating the difference between the sum of all recent gains and the sum of all recent losses and then dividing the result by the sum of all price movement over the period. This oscillator is also similar to other momentum indicators such as the Relative Strength Index and the Stochastic Oscillator … [Read more...]
Chaikin Money Flow : Application and Chart
Developed by Marc chaikin, the Chaikin formula attempts to determine if a stock is under accumulation or distribution by comparing the closing price to the high-low range of the trading session. In other words, if the stock closes near the high of the session with increased volume, the CMF increases in value. Alternatively, if the stock closes near the low of the session with … [Read more...]
Chaikin Money Flow : The Concept
Developed by Marc chaikin, The Chaikin Money Flow (CMF) indicator was created as an oscillating indicator for his earlier, cumulative indicator Accumulation/Distribution. Both indicators are used to measure the degree to which money is flowing into or out of a security or currency. Chaikin created these indicators so as to expand and improve on an earlier volume indicator, On … [Read more...]