The Klinger oscillator was developed by Stephen J. Klinger. The sense of the Klinger Histogram is to align the Klinger Volume Oscillator reference line to zero. It was developed in assistance to short- and long-term analysis. The Klinger oscillator estimates volume-based money flow directions. There are three types of information that Klinger Oscillator deals with : The … [Read more...]
Herrick Payoff Index : Application and Chart
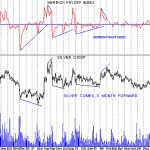
John Herrick developed the Herrick Payoff Index. It tracks volume, price and open interest into an aggregate value that is meant to capture trends and their reversals. HPI uses daily high and low prices, volume and open interest - preferably of all contracts from a period of at least three weeks. HPI applies these to prices of the most active delivery month. Instead of using … [Read more...]
Herrick Payoff Index : The Concept
Herrick Payoff Index is useful for the early spotting of changes in price trend direction. So we can use the Payoff Index to distinguish trends that will most likely be short-lived from those that are destined to continue. The Herrick Payoff Index is a good tool to forecast the money changes into future contracts. It uses analyzing of volume, price changes, and open interest … [Read more...]
Application and Chart for Envelopes in Forex Trading
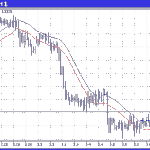
Envelopes are used to indicate the trading range of a given market above and below an average price. Basically, moving average envelopes or trading bands are calculated by taking a moving average and calculating upper and lower trading bands as a fixed percentage above and below the moving average respectively. These are considered to suggest extreme overbought or oversold … [Read more...]
Envelopes in Stock Trading : Concept
Envelopes refer to moving average bands and channels, which consist of a middle and two outer bands. Envelope theory states that prices are most likely to remain within the boundaries of the envelope. When prices go outside the envelope this can indicate an overbought/oversold situation. An envelope is generally two moving averages, one adjusted to be above price, the other … [Read more...]