The Ulcer Index is a market risk measure or technical analysis indicator. It was developed Peter Martin and Byron McCann. It has been designed as a measure of volatility, but only volatility in the downward direction but the amount of drawdown or retrenchment occurring over a period. Other volatility measures like standard deviation treat up and down movement equally, but a … [Read more...]
Ulcer Index : The Concept
The Ulcer index was developed by Peter G. Martin and Byron B. McCann. It is an indicator that is used to measure the riskiness of investments such as securities, commodities, mutual funds etc. It is created by factoring in the depth and duration of drawdown from recent peaks. A large UI value indicates that the security represents undue risk and an investor who holds it will … [Read more...]
Money Flow Index : Application & Chart

Money Flow Index is a technical indicator. It indicates the rate at which money is invested into a security and then withdrawn from it. Interpretation and calculation is similar to Relative Strength Index with the only difference that volume is important to MFI. While analyzing the money flow index, one needs to take into consideration the following points: If prices … [Read more...]
Money Flow Index : The Concept
The Money Flow Index is used as a momentum indicator that is actually similar to the Relative Strength Index in both interpretation and calculation. Though this is true but, MFI is a more rigid indicator in that it is volume-weighted, and is therefore a good measure of the strength of money flowing in and out of a security. It compares negative money flow to positive money flow … [Read more...]
ADX Indicator : Application & Chart
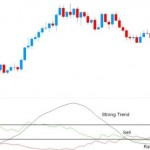
Average Directional Index is an indicator which fluctuates between 0 and 100. Readings below 20 indicate a weak trend and readings above 40 indicate a strong trend. ADX does indicates just the strength of the trend, up or down. With ADX there are two lines which are often plotted, that indicate direction. The lines are +DI (positive directional indicator) and -DI (negative … [Read more...]