The triple exponential average (TRIX) indicator is an oscillator. TRIX is usually used to identify oversold and overbought markets, and it can also be used as a momentum indicator. TRIX, like other common oscillators, oscillates around a zero line. A positive value indicates an overbought market while a negative value indicates an oversold market when it is used as an … [Read more...]
Ultimate Oscillator : Application & Chart
The Ultimate Oscillator, developed by Larry Williams combines a stock's price action during three different time frames into one bounded oscillator. Values range from 0 to 100 with 50 as the center line. Oversold territory exists below 30 and overbought territory extends from 70 to 100. Ultimate Oscillator uses three time frames which and can be specified by the user. … [Read more...]
Ultimate Oscillator : The Concept
Ultimate oscillator is a technical indicator invented by Larry Williams. Ultimate oscillator uses the weighted average of three different time periods to reduce the volatility and false transaction signals that are associated with many other indicators that mainly rely on a single time period. The Ultimate Oscillator is actually a technical analysis oscillator on a notion of … [Read more...]
Williams Accumulation/Distribution Indicator : Application & Chart
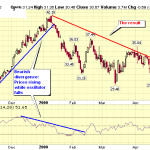
The Williams’ Accumulation/ Distribution indicator, developed by Larry Williams, aims to reflect whether the market is controlled by buyers (accumulation) or by sellers (distribution). Prices making a new low along with the A/D indicator failing to reach a new low suggest that accumulation is taking place and creates a buy signal. Prices making a new high and the indicator … [Read more...]
Williams Accumulation/Distribution Indicator : The Conept
Williams Accumulation Distribution is usually traded on divergences. Distribution is taking place when price makes a new high and the indicator fails to exceed its previous high. When price makes a new low and the WAD fails to make a new low, accumulation is occurring. The Williams’ Accumulation/ Distribution indicator, developed by Larry Williams aims to reflect whether the … [Read more...]