The Relative Strength Index (RSI), developed by J. Wellis Wilder is very useful and is a popular momentum oscillator. The RSI is used to compare the magnitude of a stock's recent gains to the magnitude of its recent losses. It then turns that information into a number that ranges from 0 to 100. It takes a single parameter, the number of time periods to use in the calculation. … [Read more...]
Relative Strength Index : The Concept
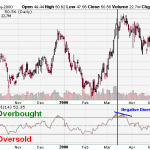
The RSI is a momentum indicator that helps in comparing the magnitude of recent gains to recent losses in an attempt to determine overbought and oversold conditions of an asset. It is calculated using the following formula: RS = Average of x days' up closes / Average of x days' down closes The RSI usually ranges from 0 to 100. Once the RSI approaches the 70 level, an … [Read more...]
Swing Index Indicator : Application & Chart
The Accumulation Swing Index helps showing the line of the real market. The Accumulative Swing Index uses a scale from 0 to 100 for an up trend and 0 to -100 for a down trend. The Swing Index was developed by Welles Wilder. The ASI has a positive value if a long-term trend is up, and if long-term trend is down indicator appears in a negative value. During sideways moving … [Read more...]
Swing Index Indicator : The Concept
The Swing Index is often used as a part of the Accumulation Swing Index because alone it tends to create an inconstant plot. The Swing Index compares the links between the ongoing prices. They can be low, high, open and close. It links these with the previous period's prices to hold aside the real security's price. The Accumulation Swing Index shows this phantom line - the … [Read more...]
Triple Exponential Average : Application & Chart
The triple exponential average (TRIX) indicator is an oscillator. TRIX is usually used to identify oversold and overbought markets, and it can also be used as a momentum indicator. TRIX, like other common oscillators, oscillates around a zero line. A positive value indicates an overbought market while a negative value indicates an oversold market when it is used as an … [Read more...]