Renko charts are price charts with rising and falling diagonal lines of boxes that are either filled or hollow. Renko charts are "time independent" charts that do not have constantly spaced time axes. A type of chart, developed by the Japanese, that is only concerned with price movement; time and volume are not included. It is thought to be named for the Japanese word for … [Read more...]
Kagi Charts
Kagi charts are price charts with thick and thin vertical lines connected by short horizontal lines. it is a type of chart developed by the Japanese in the 1870s that uses a series of vertical lines to illustrate general levels of supply and demand for certain assets. Thick lines are drawn when the price of the underlying asset breaks above the previous high price and is … [Read more...]
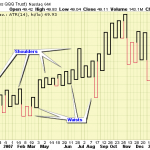
Introduction to Chart Patterns
In a day there are thousands of market participants buying and selling securities with wide variety of reasons : hope of gain, fear of loss, tax consequences, short-covering, hedging, stop-loss triggers, price target triggers, fundamental analysis, technical analysis, broker recommendations and a few dozen more. it is a danuting process to figure out why participants are … [Read more...]
Gap analysis
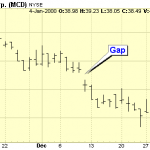
Gaps and Gap Analysis a gap is an area on a price chart indicates that there were no trades. Normally this occurs between the time period when the market closes on one day and open's up the next day. Lot's of things can cause this, such as an earnings report coming out after the stock market has closed for the day. If the earnings were significantly higher than expected, many … [Read more...]
Falling wedge- concept
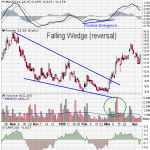
a bullish pattern that begins wide at the top and contracts as the prices falls down . This price action forms a cone that slopes down as the reaction highs and reaction lows converge. In contrast to symmetrical triangles, which have no definitive slope and no bias, falling wedges definitely slope down and have a bullish bias. However, until a resistance breakout this bullish … [Read more...]