Time series moving average The time series moving average is calculated using linear regression techniques. Rather than plotting a straight linear regression line, a time series moving average plots the last point of the line. It does this using the specified number of periods for each day. The individual points are then connected together with a line to form a time series … [Read more...]
Exponential moving average
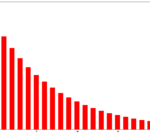
An exponential moving average (EMA), sometimes also called an exponentially weighted moving average (EWMA), applies weighting factors which decrease exponentially. The weighting for each older data point decreases exponentially, giving much more importance to recent observations while still not discarding older observations entirely. The graph at right shows an example of the … [Read more...]
Simple moving average
A simple, or arithmetic, moving average that is calculated by adding the closing price of the security for a number of time periods and then dividing this total by the number of time periods. Short-term averages respond quickly to changes in the price of the underlying, while long-term averages are slow to react. For example, to calculate a 21-day moving average of Geo2 … [Read more...]
Moving Averages
Introduction Moving averages are one of the most popular and easy to use tools available to the technical analyst. They smooth a data series and make it easier to spot trends, something that is especially helpful in volatile markets. They also form the building blocks for many other technical indicators and overlays. It is a method of calculating the average value of a … [Read more...]
The Nifty Levels for 5th November 2009
Please find the correct levels for nifty The Nifty Levels for 5th november 2009 are First Resistance = 4754 First Support =4624 Second Resistance =4797 Second Support =4537 Breakout above = 4884 Break down Below = 4494 The above levels are for intraday only For Sure Shot pack and good Gains in Nifty Please visit Nifty Live Charts.com … [Read more...]