This tool is often used in conjunction with other risk measurements such as standard deviation. Investors who are risk averse should probably stay away from securities with high UI values because, if these securities experience a severe decline, they are unlikely to recover in the near future.
Since the ulcer index measures change from a recent peak, it is more practical to think of it as a short-term risk measure.
Calculation
The index is based on a given past period of N days. Working from oldest to newest a highest price (highest closing price) seen so-far is maintained, and any close below that is a retracement, expressed as a percentage
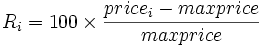
For example if the high so far is $5.00 then a price of $4.50 is a retracement of -10%. The first R is always 0, there being no drawdown from a single price.
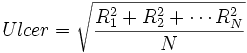
The squares mean it doesn’t matter if the R values are expressed as positives or negatives, both come out as a positive Ulcer Index.
The calculation is relatively immune to the sampling rate used. It gives similar results when calculated on weekly prices as it does on daily prices. Martin advises against sampling less often than weekly though, since for instance with quarterly prices a fall and recovery could take place entirely within such a period and thereby not appear in the index.

Measuring Drawdowns
On the very left of the chart, Intel stock had a strong, sustained movement higher, marked by the long string of green, bullish candlesticks. Notice that the Ulcer Index remained flat, well below the safe level.
Above safe level (>5): Many downward retracements, investment will cause the investor ulcers, stress, and/or difficult nights sleeping.
Below safe level (<5): A moderate to low number of price retracements to the downside; relatively few ulcers, stress, and/or difficult nights sleeping.