The ADX indicator is a tool used to measure the strength of a trend and can be very useful to determine if a trend is strong or weak. High readings indicate a strong trend and low readings indicate a weak trend. A trading range is likely to develop when the trading range is showing a low reading. So one should always avoid stocks with low readings. ADX stands for Average … [Read more...]
Archives for 16/02/2010
Free Stock Tips for 17th Februrary 2010
The Various – Daily Stock Recommendation Given by the various analysts and Stock Brokers are : Kingfisher Airlines Ltd. - Daily stock recommendation 17-02-2010 Source Action Tip Period Target Price (Rs.) Sudarshan Sukhani Buy, stop loss Rs 50 - 54.00 Andhra Pradesh Paper Mills Ltd. - Daily stock recommendation 17-02-2010 Source Action Tip … [Read more...]
Nifty Levels for 17th February 2010
Please find the correct levels for nifty The Nifty Levels for 17th February 2010 are First Resistance = 4927 First Support =4821 Second Resistance =4963 Second Support =4751 Breakout above = 5033 Break down Below =4715 The above levels are for intraday only For Sure Shot pack and good Gains in Nifty Please visit Nifty Live Charts.com … [Read more...]
Volume Oscillator Indicator : Application & Chart
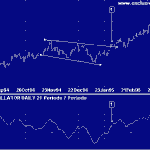
The Volume Oscillator clarifies whether the volume trend is increasing or decreasing by using the difference between a longer and a shorter moving average of volume. When the Volume Oscillator rises above zero the shorter-term volume moving average has risen above the longer-term volume moving average. This means that the short-term volume trend is higher than the longer-term … [Read more...]
Volume Oscillator Indicator : The Concept
The work of a volume oscillator is to measure volume by measuring the relationship between two moving averages. The volume oscillator indicator calculates a fast and slow volume moving average. The difference between the two is then plotted as a histogram. The fast volume moving average is usually over a period of 14 either days or weeks. The slow volume moving average is … [Read more...]