The Various Stock Tips Given by the various analysts and Stock Brokers are : Spicejet Ltd. - Daily Stock Recommendation 28-10-2009 Source Action Tip Period Target Price (Rs.) Anil Singhvi Buy, stop loss Rs 36 - 40.00 Dabur India Ltd. - Daily Stock Recommendation 28-10-2009 Source Action Tip Period Target Price (Rs.) Shomesh Kumar Buy … [Read more...]
Archives for October 2009
Triple Bottom (Reversal)
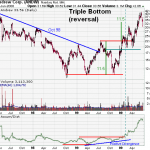
The triple bottom is a reversal pattern made up of three equal lows followed by a breakout above resistance. While this pattern can form over just a few months, it is usually a long-term pattern that covers many months.it is a pattern used in technical analysis to predict the reversal of a prolonged downtrend. The pattern is identified when the price of an asset creates three … [Read more...]
Triple Top (Reversal):concept
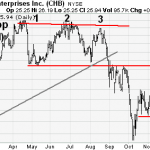
The triple top is a reversal pattern made up of three equal highs followed by a break below support. A pattern used in technical analysis to predict the reversal of a prolonged uptrend. This pattern is identified when the price of an asset creates three peaks at nearly the same price level. The bounce off the resistance near the third peak is a clear indication that buying … [Read more...]
Trend Lines

Technical analysis is built on the assumption that prices trend. Trend Lines are an important tool in technical analysis for both trend identification and confirmation. A trend line is a straight line that connects two or more price points and then extends into the future to act as a line of support or resistance. Many of the principles applicable to support and resistance … [Read more...]
Support and Resistance
Support and resistance represents key junctions where the forces of demand and supply meet. In the financial markets, prices are driven by excessive supply (down) and demand (up).As demand increases, prices advance and as supply increases, prices decline. When supply and demand are equal, prices move sideways as bulls and bears slug it out for control. What Is Support? The … [Read more...]