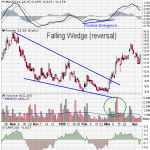
a bullish pattern that begins wide at the top and contracts as the prices falls down . This price action forms a cone that slopes down as the reaction highs and reaction lows converge. In contrast to symmetrical triangles, which have no definitive slope and no bias, falling wedges definitely slope down and have a bullish bias. However, until a resistance breakout this bullish … [Read more...]
Archives for 27/10/2009
Double top :concept
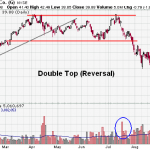
A term used in technical analysis to describe the rise of a stock, a drop, another rise to the same level as the original rise, and finally another drop.The double top is a major reversal pattern that forms after an extended uptrend. As its name implies, the pattern is made up of two consecutive peaks that are roughly equal, with a moderate trough in-between. The double top … [Read more...]
Double Bottom(Reversal):Concept

It is a charting pattern used in technical analysis. It describes the drop of a stock (or index), a rebound, another drop to the same (or similar) level as the original drop, and finally another rebound.As its name implies, the pattern is made up of two consecutive troughs that are roughly equal, with a moderate peak in-between. The double bottom is a major reversal pattern … [Read more...]
Candlestick Pattern Dictionary

Following are some terms in use for candlesticks patterns. * Abandoned Baby: A rare reversal pattern characterized by a gap followed by a Doji, which is then followed by another gap in the opposite direction. The shadows on the Doji must completely gap below or above the shadows of the first and third day. * Dark Cloud Cover: In candlestick charting, a pattern where a … [Read more...]
Chart Analysis for stock market

What Are Charts? A price chart is a sequence of prices plotted over a specific time frame. In statistical terms, charts are referred to as time series plots. On the chart, the y-axis (vertical axis) represents the price scale and the x-axis (horizontal axis) represents the time scale. Prices are plotted from left to right across the x-axis with the most recent plot being … [Read more...]