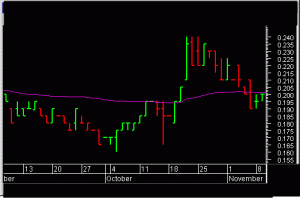
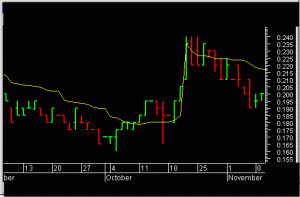
Variable moving average
A VMA is an EMA that’s able to regulate its smoothing percentage based on market inconstancy automatically. Its sensitivity grows by providing more weight to the ongoing data as it generates a better signal indicator for short and long term markets.
The majority of ways for measuring Moving Averages cannot compensate for sideways moving prices versus trending markets and often generate a lot of false signals. Longer term moving averages are slow to react to reversals in trend when prices move up and down over a long period of time. A Variable Moving Average regulates its sensitivity and lets it function better in any market conditions by using automatic regulation of the smoothing constant.
To calculate the Variable Moving Average (VMA):
with VR = Volatility Ratio
VMA = [ { 0.0788 * VR } * Close ] + [ { (1 – 0.078) * VR } *
Volume adjusted moving average
The calculation for a volume adjusted moving average is somewhat complex; however, it is conceptually easy to understand. All moving averages (even volume adjusted) use some type of weighting scheme to “average” the data. Exponential and weighted moving averages assign the majority of weight to the most recent data. Simple moving averages assign the weight equally across all data. Variable moving averages assign the majority of the weight to the most volatile data. And as its name implies, volume adjusted moving averages assign the majority of weight to the day’s with the most volume.
A volume adjusted moving average is calculated as follows:
1.
Calculate the average volume using every time period in the chart.
2.
Calculate the volume increment by multiplying the average volume by 0.67.
3.
Calculate each period’s volume ratio by dividing each period’s actual volume by the volume increment.
Starting at the most recent time period and working backwards, multiply each period’s price by the period’s volume ratio and cumulatively sum these values until the user-specified number of volume increments is reached. Note that only a fraction of the last period’s volume will likely be used

