List/Grid General Subscribe RSS feed of category General
Recent Trading Results with NLC Profit Pro (25 May 2013)
Our Software “NLC Profit Pro” Rocked Again. Giving Clear Entry very early in the direction of Market. We made Profit of 1088 Points in BankNifty in 2 Trades and and 314 Points of Profit in Nifty in 2 Trades. Check Yourself BANK NIFTY Profit Nifty Profit Join Our Premium services to make similar profits.
Profit of 287 Points in BankNifty on 13 May 2013
Are you finding its hard to make profit in Markets these days ? Well Our Clients are enjoying Profit . Our Software “NLC Profit Pro” Gave Profit of 287 Points in 2 calls See the Attached ScreenShot. Join Our Premium services to make similar profits.
BankNifty View in Coming Days ( 16 July 2012)
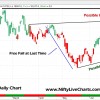
BankNifty Targets and view on Daily Charts for week starting from 16 July 2012. BankNifty has upside resistance at 11250 Levels which was made during Feb 2012 and we saw heaving Profit booking and fresh short building from those levels. Currently BankNifty is trading at 10,617 after touching the 10,800 mark in last couple of days. A rally from here…
Nse Bse Holiday List 2012 – Stock Market Holiday List 2012
Planning for some vacation and need the list of holidays in indian stock markets ? Here they are. the Proposed list of NSE / BSE holiday list in calender year 2012 can be found right below. please cross check the same from your source also. S No Date Day Description 1 26-Jan-12 Thursday Republic Day 2 20-Feb-12 Monday Mahashivratri 3…
EOD Candle Sticks Report for Stocks 26 September 2011
End of Day CandleSticks Report for FNO Stock for 26 September 2011.Long term Players can check their positions as per these Reports. See the Summary Ticker Date/Time Candle Pattern Close Change % Volume Buy/Sell Full name ALBK_F1 9/26/2011 Hammer 161.40 0.31 896 B ALOKTEXT_F1 9/26/2011 Hammer 17.00 -0.58 907 B BAJAJHLDNG_F1 9/26/2011 Inverted Hammer 726.00 -1.22 23 B BANKINDIA_F1 9/26/2011…
26 September 2011 Daily Stock Trend Analysis
Check the Trend analysis results for the FNO Stocks on Different time Frames for 26 September 2011 Ticker Date/Time MA-140 MA-60 MA-8 Overall Trend Comments 3IINFOTECH_F1 9/26/2011 – – – Down Trend Deep Down Trend, Avoid Long ABAN_F1 9/26/2011 — — — Strong Down Trend Deep Down Trend, Avoid Long ABB_F1 9/26/2011 + — — No Trend No Clear Trend…
21 September 2011 Daily Stock Trend Analysis
Check the Trend analysis results for the FNO Stocks on Different time Frames for 21 September 2011 Ticker Date/Time MA-140 MA-60 MA-8 Overall Trend Comments 3IINFOTECH_F1 9/20/2011 – - – Down Trend Deep Down Trend, Avoid Long ABAN_F1 9/20/2011 — — — Strong Down Trend Deep Down Trend, Avoid Long ABB_F1 9/20/2011 +++ + — No Trend Bulls can Stop,…
Nifty Support and Resistance Levels for 20 September 2011
Nifty Trading Levels for 20 September 2011 – Nifty Future Support and Resistance Levels – Daily Nifty Level (20 September 2011) Trading as per the support and resistance levels may be quite useful for intraday and Positional trading in stocks and index. Resistance is termed as the level where the stock generally gets some opposite force before it can go…
Bank Nifty Support and Resistance Levels for 6 june 2011
Bank Nifty Trading Levels for 6 june 2011 – Bank Nifty Future Support and Resistance Levels – Daily Bank Nifty Level (6 june 2011) Trading as per the support and resistance levels may be quite useful for intraday and Positional trading in stocks and index. Resistance is termed as the level where the stock generally gets some opposite force before…
Nifty Support and Resistance Levels for 6 june 2011
Nifty Trading Levels for 6 june 2011 – Nifty Future Support and Resistance Levels – Daily Nifty Level (6 june 2011) Trading as per the support and resistance levels may be quite useful for intraday and Positional trading in stocks and index. Resistance is termed as the level where the stock generally gets some opposite force before it can go…
Know How Financial Statement Analysis Helps to Evaluate Stock Investment
A company’s stock investment accounts are crucial knowledge for management as well as for the investors. It shows a path to both management and investors alike to determine where the company’s extra cash has been deployed. First of all, decide what accounting methodology is being used to account for the company’s stock investments. You can consider the option of the…
