Concept The Forecast Oscillator is an extension of the linear regression based indicators developed by Tushar Chande. The Forecast Oscillator plots the percentage difference between the forecast price (generated by an x-period linear regression line) and the actual price. The oscillator is above zero when the forecast price is greater than the actual price. Conversely, it's … [Read more...]
Archives for 04/02/2010
Forecast Oscillator : The Concept
The Forecast Oscillator was developed by Tushar Chande. The Forecast Oscillator is an extension of the linear regression based indicators, by definition. It is a percentage comparison of the price of an issue and the price as indicated by the Time Series Forecast Oscillator. The oscillator is above zero when the forecast price is greater than the actual price. Conversely, … [Read more...]
Dynamic Momentum Index : Application and Chart
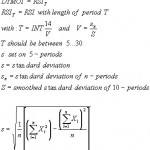
Simply speaking, The Dynamic Momentum Index is an adaptive RSI. This means it adjusts itself according to the current volatility of the market. Accordingly, the period length will be shortened during volatile phases and lengthened during calmer market phases, unlike RSI. RSI usually uses 14 periods but the length of periods in DMI changes according to the conditions of the … [Read more...]
Dynamic Momentum Index : The Concept
By definition, The Dynamic momentum index is an indicator used in technical analysis that determines overbought and oversold conditions of a particular asset. This indicator is very similar to the relative strength index (RSI). The main difference between the two is that the RSI uses a fixed number of time periods (usually 14), while the dynamic momentum index uses different … [Read more...]
Directional Movement Index : Application and Chart
Further calculation of the True range is necessary to calculate the Directional Indicators (+DI and -DI). The true range is always positive. It is defined as the current highest value of the difference among today’s highest price minus today’s lowest price; today’s highest price minus yesterday’s closing price; and today’s lowest price minus yesterday’s closing price. Wilder, … [Read more...]